Given a blank Excel workbook, navigate the interface and correctly identify the function of cells, rows, columns, sheets, and the formula bar in a guided exploration exercise (CO-6)
Enter and format healthcare data (patient names, dates, vitals, costs) using appropriate data types and number formats to ensure accuracy and readability (CO-6)
Build a basic healthcare tracking spreadsheet with formatted headers, column sizing, cell styles, and conditional formatting that a colleague could use without additional explanation (CO-6)
Evaluate a poorly formatted spreadsheet and identify at least three changes to data types, alignment, or formatting that would improve data accuracy and readability (CO-6)
Part 1 of 5
Part 1 of 5 — The Excel Interface: Your Healthcare Data Command Center
Microsoft Excel is the most widely used spreadsheet application in the world, and it plays a critical role in healthcare administration. From tracking patient vitals to managing supply inventories and scheduling staff shifts, Excel provides the grid-based workspace that healthcare professionals rely on every day. Before you can harness its power, you need to understand the interface — the controls and areas you will interact with to enter, organize, and analyze data.
Opening Excel and Creating a Workbook
When you launch Microsoft Excel, you are greeted by the Start screen, which offers options to create a Blank workbook or choose from a gallery of templates. For most healthcare data tasks, you will start with a blank workbook. According to Microsoft's official documentation, a workbook is an Excel file that contains one or more worksheets (also called sheets or tabs). Think of a workbook as a binder and each worksheet as a separate page within it. A clinic might use one workbook with separate sheets for each month's patient visit data, or a medical office might have one sheet for the appointment schedule and another for supply orders.
Key Interface Elements
Once you open a blank workbook, the Excel window presents several important areas you must learn to navigate. Explore each component below:
☰
Ribbon
Horizontal toolbar with tabs (Home, Insert, Formulas, Data, etc.) grouping related commands.
fx
Formula Bar
Displays and allows editing of the active cell's contents or formula. Essential for reviewing data.
A1
Name Box
Shows the cell reference of the active cell. Type an address like A500 to jump directly to it.
▦
Worksheet Grid
Columns (A, B, C) and rows (1, 2, 3) forming cells where you enter and organize all your data.
□
Sheet Tabs
Switch between worksheets at the bottom of the window. Rename, color-code, or add new sheets.
∑
Status Bar
Displays quick calculations (Sum, Average, Count) for selected cells at the bottom of the window.
⚙
Quick Access Toolbar
Customizable toolbar at the top-left for frequently used commands like Save, Undo, and Redo.
Cell References and Ranges
Understanding cell references is fundamental to everything you do in Excel. The A1 reference style identifies each cell by its column letter followed by its row number. For example, the cell in the third column and fifth row is C5. A range is a group of adjacent cells identified by the top-left and bottom-right cells, separated by a colon. The range A1:C10 includes all cells from column A through column C, rows 1 through 10. Ranges are used constantly in formulas, formatting, and printing.
Healthcare Connection
Healthcare Connection: Imagine you are setting up a patient vitals log. Column A holds patient names, column B holds dates, and columns C through F hold systolic blood pressure, diastolic blood pressure, heart rate, and temperature. The cell reference C2 might contain the first patient's systolic reading. The range C2:F50 would encompass all vitals data for up to 49 patients. Understanding these references is the first step toward building formulas that analyze your clinical data.
Interface Element
Location
Function
Healthcare Example
Ribbon
Top of window (tabbed toolbar)
Groups commands by category (Home, Insert, Formulas, Data, etc.)
Use the Home tab to bold column headers in a patient tracking sheet
Formula Bar
Below the Ribbon
Displays and allows editing of the active cell's contents or formula
Review a SUM formula calculating total supply costs
Name Box
Left of Formula Bar
Shows the address of the active cell; type an address to navigate directly
Jump to cell A500 in a large patient roster by typing A500
Worksheet Grid
Center of window
Rows and columns forming cells where data is entered and organized
Enter patient names in column A, vitals readings in columns B-F
Sheet Tabs
Bottom of window
Switch between worksheets; rename, add, delete, or color-code tabs
Separate tabs for January, February, and March patient visits
Status Bar
Very bottom of window
Displays quick calculations (Sum, Average, Count) for selected cells
Select a column of blood pressure readings to see the average instantly
Quick Access Toolbar
Top-left corner (above Ribbon)
Customizable toolbar for frequently used commands (Save, Undo, Redo)
Add Print Preview for quick access when printing medication logs
Part 2 of 5
Part 2 of 5 — Data Entry: Text, Numbers, Dates, and Auto-Fill
The core purpose of a spreadsheet is to hold data, and Excel accepts several types of data in each cell. Understanding these data types and how Excel treats them is essential for building accurate healthcare spreadsheets.
Text entries — also called labels — are any entries that Excel does not recognize as numbers, dates, or formulas. Column headers like Patient Name, Date of Visit, or Diagnosis Code are text entries. By default, text aligns to the left side of a cell.
Text entries cannot be used in mathematical calculations, but they are crucial for labeling and organizing your data. In healthcare spreadsheets, text entries often include patient names, medical record numbers (MRNs), department names, and procedure descriptions.
Number entries are values that Excel can use in calculations. Examples include blood pressure readings (120, 80), patient ages (45), dosage amounts (500), and dollar amounts (25.00). By default, numbers align to the right side of a cell.
If you enter a number and it appears left-aligned, Excel may be interpreting it as text — often because of an invisible space or apostrophe before the number. Watch for this common data entry issue, especially when working with medical record numbers or insurance ID numbers that may contain leading zeros.
Date and time entries are a special category in Excel. While dates appear as text (e.g., 02/16/2026), Excel actually stores them as serial numbers behind the scenes. This allows Excel to perform calculations with dates, such as determining how many days have passed between a patient's admission and discharge.
Enter dates in a format Excel recognizes, such as 2/16/2026, Feb 16, 2026, or 2026-02-16. If Excel does not recognize your date format, it will store the entry as text, and date calculations will not work.
Entering Data Efficiently
When entering data into Excel, several keyboard techniques speed up the process:
Tab – Press Tab to move one cell to the right after entering data. This is efficient when filling out a row of patient information (name, date, vitals, notes).
Enter – Press Enter to move one cell down. Use this when entering a list of values in a column, such as a series of patient names.
Ctrl+Enter – Confirms the entry and keeps the cursor in the same cell. Useful when you want to verify data before moving on.
Escape – Cancels the current entry and restores the cell to its previous value.
Auto-Fill: Excel's Time-Saving Feature
One of Excel's most powerful data entry features is Auto-Fill. When you enter data that follows a pattern — such as dates, days of the week, months, or numbered sequences — Excel can automatically extend the pattern to fill adjacent cells. To use Auto-Fill:
Enter the first value (e.g., Monday or January) in a cell.
Hover over the small square in the bottom-right corner of the cell (the fill handle).
Click and drag the fill handle down or across to fill the series.
For numeric sequences, enter at least two values to establish the pattern (e.g., enter 1 in one cell and 2 in the next), select both cells, then drag the fill handle. Auto-Fill is invaluable in healthcare spreadsheets — you can quickly generate a column of appointment dates, a series of patient ID numbers, or a list of months for a yearly tracking report.
The Fill Handle — drag the small square to auto-fill adjacent cells with patterns or series — Microsoft Support
Editing Cells
To edit an existing cell, you have three options:
Overwrite – Simply select the cell and start typing. The new entry replaces the old one entirely.
Edit Mode – Double-click the cell (or press F2) to place the cursor inside the cell, allowing you to edit part of the content without retyping everything.
Formula Bar editing – Select the cell, then click in the formula bar to edit the contents there. This is especially useful for long text entries or complex formulas.
To clear a cell's contents without deleting the cell itself, select the cell and press the Delete key. To undo a mistake, press Ctrl+Z immediately. Excel supports multiple levels of undo, so you can step back through several recent changes.
Pro Tip
Pro Tip: When entering patient vitals into a daily tracking spreadsheet, use Tab to move efficiently across columns (name, date, systolic BP, diastolic BP, heart rate, temperature, SpO2). Use Auto-Fill to pre-populate the date column for the entire month. If you accidentally overwrite a reading, press Ctrl+Z to undo the change immediately.
▶
Excel Tutorial for Beginners• Full Course • 120 min
Part 3 of 5
Part 3 of 5 — Number Formatting and Cell Styles
Raw data in Excel is only useful if it is readable and clearly understood. Number formatting controls how values appear in cells without changing the underlying data. Cell styles provide visual structure that makes spreadsheets scannable and professional. Together, these tools transform a wall of numbers into a clear, actionable healthcare document.
Number Format Types
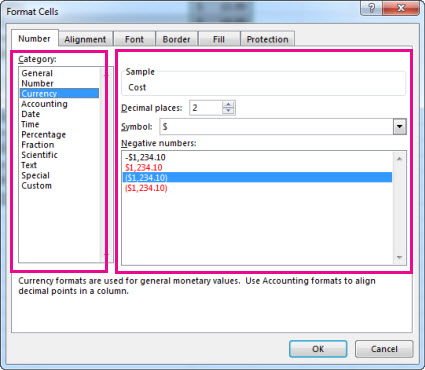
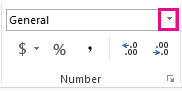
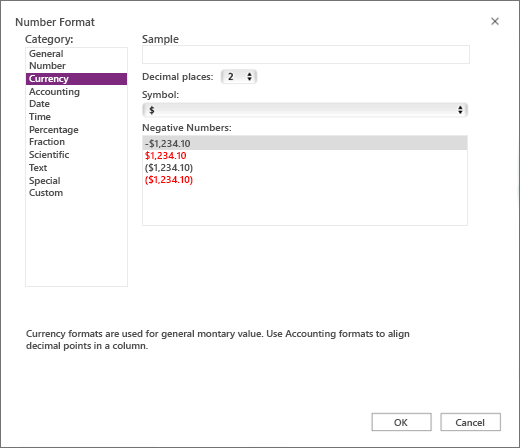
Excel offers a wide variety of built-in number formats. To apply a number format, select the cells, then use the Number Format drop-down in the Home tab's Number group, or right-click and choose Format Cells.
The Format Cells dialog (Ctrl+1) gives you complete control over how data appears — Microsoft SupportQuick number formatting — use the dropdown on the Home tab for common formats — Microsoft Support
General – The default format. Excel displays the number as entered with no specific formatting. Suitable for most healthcare data entry before you decide on a specific format.
Number – Displays values with a fixed number of decimal places. Use this for vitals readings where precision matters (e.g., temperature: 98.6, weight: 165.5).
Currency – Adds a dollar sign and two decimal places ($25.00). Use this for any financial data: copay amounts, supply costs, or billing charges.
Accounting – Similar to Currency but aligns dollar signs at the left edge of the cell and decimal points in a column. Preferred for formal financial reports where column alignment is important.
Select Currency from the Category list to format cells with dollar signs and decimal places — Microsoft Support
Percentage – Multiplies the value by 100 and displays a percent sign. Enter 0.85 and format as Percentage to display 85%. Use this for compliance rates, satisfaction scores, or immunization coverage percentages.
Date – Displays date serial numbers in a readable format (e.g., 2/16/2026 or February 16, 2026). Choose a consistent date format across your entire worksheet.
Time – Displays time values (e.g., 8:30 AM or 14:30). Useful for tracking appointment start/end times or shift schedules.
Custom – Allows you to create specialized formats using format codes. For example, you could format phone numbers as (###) ###-#### or medical record numbers with leading zeros (00000#).
Applying Cell Styles for Visual Organization
Beyond number formatting, Excel provides cell styles that combine font, border, shading, and alignment settings into one-click presets. These are found in the Home tab under Cell Styles. Key cell style categories include:
Titles and Headings – Larger, bold fonts for worksheet titles and section headers.
Themed Cell Styles – Color-coordinated backgrounds and fonts that match the workbook's theme.
Number Format Styles – Quick-apply styles for Currency, Comma, and Percent formats.
Good, Bad, and Neutral – Color-coded styles (green, red, yellow) for highlighting status indicators.
For healthcare spreadsheets, using consistent cell styles ensures that anyone reading the spreadsheet can quickly identify headers, data sections, totals, and alerts.
Formatting Borders, Shading, and Column Widths
Borders and shading help define the structure of your worksheet visually:
Borders – Select cells and use the Borders button on the Home tab to add or remove cell borders. Common options include All Borders, Outside Borders, and Bottom Border (for totals rows).
Fill Color (Shading) – Use the Fill Color button to add background color to cells. In healthcare spreadsheets, shade header rows in a distinct color, highlight abnormal lab values in red, or use alternating row colors for easier reading.
AutoFit – Double-click the right edge of a column header to automatically resize the column to fit the widest entry. This is the fastest way to ensure all data is visible.
Exact Sizing – Right-click the column header, choose Column Width, and enter a specific number for uniform columns across your worksheet.
Apply cell borders from the Home tab — choose from common border styles — Microsoft Support
Healthcare Connection
Healthcare Connection: A clinic's daily patient vitals spreadsheet benefits enormously from proper formatting. Currency format on the copay column prevents confusion between $25 and 25 visits. Date format ensures that 2/16/2026 is not mistakenly interpreted as a math problem. Percentage format on a vaccination rate column instantly communicates 92% compliance to a clinic manager reviewing the data.
Number Format
What It Does
Healthcare Example
Display
General
No specific format; displays value as entered
Patient age
45
Number
Fixed decimal places with optional comma separator
Body temperature reading
98.60
Currency
Dollar sign with two decimal places
Patient copay amount
$25.00
Accounting
Aligned dollar signs and decimals in columns
Monthly supply budget report
$ 1,250.00
Percentage
Value multiplied by 100 with percent sign
Flu vaccination compliance rate
92%
Date (Short)
Displays date in compact format
Appointment date
2/16/2026
Date (Long)
Displays date with full month name
Patient discharge date
February 16, 2026
Time
Displays time in hours and minutes
Appointment start time
8:30 AM
Custom (Phone)
User-defined format code for phone numbers
Patient contact number
(555) 123-4567
Custom (MRN)
Leading zeros preserved for ID numbers
Medical record number
007452
Part 4 of 5
Part 4 of 5 — Conditional Formatting and Freezing Panes
Two Excel features are especially valuable for healthcare professionals who work with large datasets: conditional formatting and freezing panes. Conditional formatting automatically changes the appearance of cells based on their values, making it easy to spot trends and outliers. Freezing panes keeps header rows or columns visible as you scroll through extensive data.
Conditional Formatting: Visual Alerts for Healthcare Data
Conditional formatting applies formatting rules — colors, icons, data bars — to cells based on conditions you define. Access it from the Home tab by selecting Conditional Formatting in the Styles group. Key rule types include:
The Conditional Formatting menu on the Home tab offers multiple ways to visually highlight data patterns — Microsoft Support
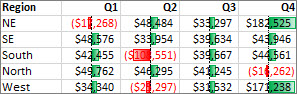
Highlight Cells Rules – Format cells that are greater than, less than, between, or equal to a specified value. Example: Highlight all systolic blood pressure readings greater than 140 in red to flag hypertension.
Top/Bottom Rules – Format the top 10 items, bottom 10 items, above average, or below average values. Example: Highlight the top 10% longest patient wait times.
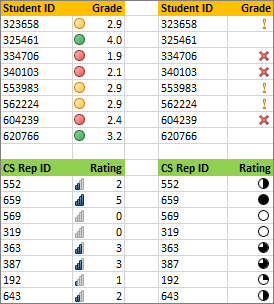
Data Bars – Add horizontal bars inside cells that reflect the relative value. Example: Apply data bars to patient satisfaction scores to visually compare results.
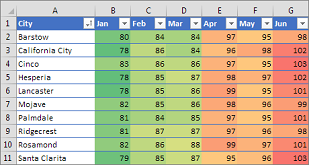
Color Scales – Apply a gradient of two or three colors across a range. Example: Green-to-red scale on lab values where green is normal and red is critical.
Icon Sets – Add icons (arrows, flags, traffic lights) based on value thresholds. Example: Traffic light icons on a compliance dashboard — green for compliant, yellow for at risk, red for non-compliant.
Conditional formatting automatically changes cell colors based on values — perfect for highlighting abnormal patient readings — Microsoft SupportIcon sets add visual indicators like arrows, traffic lights, and flags directly in cells — Microsoft SupportData bars provide an instant visual comparison of values across a range — Microsoft Support
Step-by-Step
Step-by-Step: To create a conditional formatting rule for blood pressure alerts: (1) Select the BP column range, e.g. C2:C100. (2) Go to Home > Conditional Formatting > Highlight Cells Rules > Greater Than. (3) Enter the threshold value (140). (4) Choose a formatting style (Light Red Fill with Dark Red Text). (5) Click OK. Any cell with a value greater than 140 will automatically turn red.
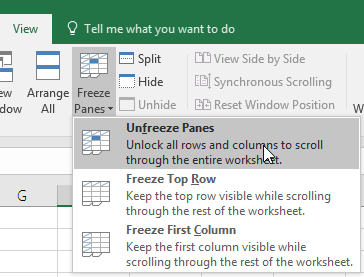
Freezing Panes: Keeping Headers Visible
When your spreadsheet contains dozens or hundreds of rows, scrolling down causes the header row to disappear. Freeze Panes solves this by locking specific rows or columns in place while the rest of the worksheet scrolls freely.
Freeze Top Row locks the first row so it remains visible as you scroll down. This is the most common use case for healthcare spreadsheets with a single header row. Go to View > Freeze Panes > Freeze Top Row.
Freeze First Column locks the first column so it remains visible as you scroll right. Useful when patient names are in column A and you have many columns of data extending to the right. Go to View > Freeze Panes > Freeze First Column.
Custom Freeze Panes lets you freeze any combination. Select a cell, then choose Freeze Panes. Excel freezes all rows above and all columns to the left of the selected cell. Example: Select cell B3 to lock rows 1-2 (title and headers) and column A (patient names) simultaneously.
To unfreeze, go to View > Freeze Panes > Unfreeze Panes. You can only have one freeze configuration at a time.
Freeze Panes from the View tab — keep headers visible while scrolling — Microsoft Support
Healthcare Connection
Healthcare Connection: A clinic manager maintaining a spreadsheet of 200 patients' quarterly vitals needs both conditional formatting and frozen panes. Freeze the top row so the headers (Patient Name, Date, Systolic BP, Diastolic BP, Heart Rate, Temperature) are always visible while scrolling through 200 rows. Apply conditional formatting to the blood pressure columns so that any reading above 140/90 is highlighted in red, instantly alerting staff to patients who may need follow-up care.
Part 5 of 5 — Building Your First Healthcare Spreadsheet: Patient Vitals Tracker
Now that you understand the Excel interface, data entry, formatting, conditional formatting, and freezing panes, let's put it all together by building a practical healthcare spreadsheet step by step. This walkthrough simulates a real task you might perform in a medical office: creating a patient vitals tracking spreadsheet that records daily readings for a group of patients.
Before entering any data, plan the columns and data types you need:
Column A: Patient Name (Text)
Column B: Medical Record Number (Text/Custom format with leading zeros)
Column C: Date of Visit (Date format)
Column D: Systolic BP (Number)
Column E: Diastolic BP (Number)
Column F: Heart Rate (BPM) (Number)
Column G: Temperature (°F) (Number with 1 decimal)
Column H: SpO2 (%) (Percentage)
Column I: Notes (Text)
In row 1, enter each column header. Select the entire header row, then apply:
Set the font to bold and size 12.
Apply a fill color (e.g., navy #1d6ba6 with white text).
Center-align the header text.
Add a bottom border to visually separate headers from data.
Begin entering data in row 2 using proper techniques:
Type the patient name and press Tab to move to the next column.
Enter the MRN, date, and vitals readings across the row.
Press Enter at the end of each row to move to the next patient.
Use Auto-Fill for the Date column if all patients were seen on the same date.
After entering data, apply appropriate number formats:
Select the Date column and format as Short Date (2/16/2026).
Select the Temperature column and format as Number with 1 decimal place (98.6).
Select the SpO2 column and format as Percentage with 0 decimal places (98%).
Select the MRN column and apply a Custom format of 000000 to preserve leading zeros.
Select all columns and go to Home > Format > AutoFit Column Width to ensure all data is visible. Then set up clinical alert rules:
Select the Systolic BP column, apply Highlight Cells Rules > Greater Than > 140 with red fill to flag hypertension.
Select the Temperature column, apply Greater Than > 100.4 with red fill to flag fever.
Select the SpO2 column, apply Less Than > 0.95 with red fill to flag low oxygen saturation.
Go to View > Freeze Panes > Freeze Top Row so you can scroll through dozens of patients while always seeing column headers.
Save your workbook as an .xlsx file with a descriptive name following your clinic's convention (e.g., Patient_Vitals_Feb2026.xlsx). To print, go to File > Print, review the preview, and set Landscape orientation if the spreadsheet is wider than it is tall.
Formatting a Clinic Schedule
The same skills apply to creating a clinic schedule spreadsheet. Columns might include Time Slot, Monday through Friday, with patient names or appointment types in each cell. Use merged cells for the title row, borders to create a grid, fill colors to distinguish morning from afternoon slots, and conditional formatting to highlight open appointment slots in green.
Key Takeaway
The patient vitals tracker you just built is not a hypothetical exercise — it mirrors the kind of spreadsheet that medical assistants, nursing aides, and office staff create and maintain every day. Whether you end up in a physician's office, urgent care clinic, or hospital department, the ability to set up, format, and maintain an organized Excel spreadsheet is a fundamental healthcare administration skill.
Format Lab: Healthcare Data Edition
Match raw healthcare data values to the correct Excel number format — 7 real-world scenarios
Raw Cell Value
B2
98.6
Value 1 of 7
★ 0/0
A patient's body temperature reading from the clinic thermometer.
Which Excel number format should be applied?
0/7
Formats Matched Correctly
Knowledge Check
A medical assistant is entering patient vitals into an Excel spreadsheet and wants to review the exact contents of a cell before confirming an edit. Which part of the Excel interface displays the full contents of the currently selected cell?
Correct! The Formula Bar is located below the Ribbon and displays the complete contents of the active cell, including text, numbers, and formulas. The Status Bar shows quick calculations like Sum and Average, the Name Box shows the cell address, and Sheet Tabs switch between worksheets.
Not quite. The Formula Bar is the correct answer. It is located below the Ribbon and displays the complete contents of the active cell. The Status Bar shows quick calculations, the Name Box shows the cell address, and Sheet Tabs switch between worksheets.
Knowledge Check
A billing specialist enters the value 0.15 into a cell that represents a 15% insurance discount rate. Which number format should be applied so the cell displays '15%' instead of '0.15'?
Correct! Percentage format multiplies the underlying value by 100 and appends a percent sign. When you enter 0.15 and apply Percentage format, Excel displays 15%. Currency and Accounting formats add dollar signs, while Custom format is used for non-standard formats like phone numbers or medical record numbers.
Not quite.Percentage format is the correct answer. It multiplies the value by 100 and appends a % sign, so 0.15 becomes 15%. Currency and Accounting add dollar signs, and Custom is for non-standard formats.
Knowledge Check
A nurse wants Excel to automatically highlight any patient temperature reading above 100.4°F in red. Which Excel feature should the nurse use?
Correct! Conditional Formatting automatically applies visual formatting (colors, icons, data bars) to cells based on rules you define, such as "greater than 100.4." Cell Styles apply static formatting that does not change based on cell values, Data Validation restricts what data can be entered, and Number Formatting controls how values display but does not add color-based alerts.
Not quite.Conditional Formatting is the correct answer. It automatically applies colors, icons, or data bars based on rules you define. Cell Styles are static, Data Validation restricts input, and Number Formatting only changes how values display.
Lesson 4.1 Summary
The Excel interface includes the Ribbon, Formula Bar, Name Box, worksheet grid, sheet tabs, and Status Bar — each serving a specific purpose in healthcare data management.
Excel accepts text (labels), numbers (values), and dates — each aligned and treated differently. Auto-Fill speeds up repetitive data entry.
Number formatting (General, Number, Currency, Percentage, Date, Custom) controls how values display without changing the underlying data.
Conditional formatting creates automatic visual alerts — essential for flagging abnormal patient readings like high blood pressure or fever.
Freeze Panes keeps header rows visible when scrolling through large patient datasets.
Building a patient vitals tracker combines all skills: planning structure, entering data, applying formats, conditional formatting, and freezing panes.